Retailer stress

Walmart, Target, Home Depot, and Lowes have adopted a significant on-line presence and have prospered despite the pandemic. Others have not been so lucky, here’s the recap:

26 retailers have filed for bankruptcy in 2020 so far:

Stein Mart (Aug. 12)                                       Tailored Brands (Aug. 2)

Lord & Taylor (Aug. 2)                                    Ascena (July 23)

The Paper Store (July 14)                             RTW Retailwinds (July 13)

Muji USA (July 10)                                         Sur La Table (July 8)

Brooks Brothers (July 8)                               G-Star Raw (July 3)

Lucky Brand (July 3)                                     GNC (June 23)

Tuesday Morning (May 27)                            Centric Brands (May 18)

J.C. Penney (May 15)                                     Stage Stores (May 11)

Aldo (May 7)                                                    Neiman Marcus (May 7)

J. Crew (May 4)                                              Roots USA (April 29)

True Religion (April 13)                                  Modell's Sporting Goods (March 11)

Art Van Furniture (March 9)                         Bluestem Brands (March 9)

Pier 1 (Feb. 17)                                               SFP Franchise Corp (Jan. 23)

J.C. Penney looks like it may survive a bit longer as mall owners Simon Property Group Inc. and Brookfield Property Partners LP agreed to acquire them out of bankruptcy for $800 million, keeping the beleaguered department-store chain alive amid the coronavirus pandemic.

If approved in bankruptcy court, the deal will prevent the closure of hundreds of locations across malls and shopping centers that face rising vacancies due to Covid-19 restrictions.

The Federal Reserve reports

The latest Federal Reserve survey of U.S. economic activity found generally modest gains in August but also pessimism about the future given the threats posed by the coronavirus. The Fed says the theme is the continued uncertainty stemming from the pandemic and its negative effect on consumer and business activity.

The report, based on responses gathered before Aug. 24, found that economic activity had increased modestly from late July but remained well below levels seen before the pandemic hit in March.

The Beige Book, was compiled from responses gathered from the Fed’s 12 regional banks. The information will help inform Fed policymakers when they next meet to set interest-rate policies Sept. 15-16.

Manufacturing growth continues

Manufacturing output, for the month of August, headed up for the third consecutive month, according to data released by the Institute for Supply Management (ISM).

ISM reported that the report’s key metric, the PMI, was 56 (a reading of 50 or higher indicates growth), which topped July’s reading by 1.8 percent. The PMI topped the 50 mark in June, at 52.6, and was followed by a 54.2 reading in July. And August’s PMI represents the highest PMI reading over the last 12 months and is 6.2 percent above the 12-month average of 49.2. ISM also noted that the overall economy grew for the fourth straight month in August, following a decline in April, which snapped a stretch of 131 consecutive months of economic expansion.

ISM reported that 15 of the 18 manufacturing sectors it tracks saw growth in August, including: Wood Products; Plastics & Rubber Products; Food, Beverage & Tobacco Products; Textile Mills; Chemical Products; Computer & Electronic Products; Primary Metals; Fabricated Metal Products; Machinery; Apparel, Leather & Allied Products; Nonmetallic Mineral Products; Miscellaneous Manufacturing; Electrical Equipment, Appliances & Components; Paper Products; and Transportation Equipment. The three industries reporting contraction in August are: Printing & Related Support Activities; Petroleum & Coal Products; and Furniture & Related Products.

New orders, which are commonly referred to as the engine that drives manufacturing, climbed 6.1 percent to 67.6, growing for the third straight month, with the six top manufacturing sectors each reporting growth. What’s more, the August reading is the highest since January 2004’s 70.6. Inventories slipped 2.6 percent, to 38.1, which ISM described as a level that is “too low” and has been down for 47 months straight.

eCommerce drives demand in industrial real estate

According to Newmark Knight Frank national research, asking rents for 1Q2020 were up 4.1 percent from the year before, and vacancy was at a cyclical low of 5.4 percent. Construction was at a cyclical high - 68.2 million square feet of new space came on the market, and 322.7 million sf were under construction.

An April report from Marcus & Millichap suggested that warehouses and distribution centers could weather the COVID-19 crisis “as much-needed supplies are funneled through a smaller supply chain.”

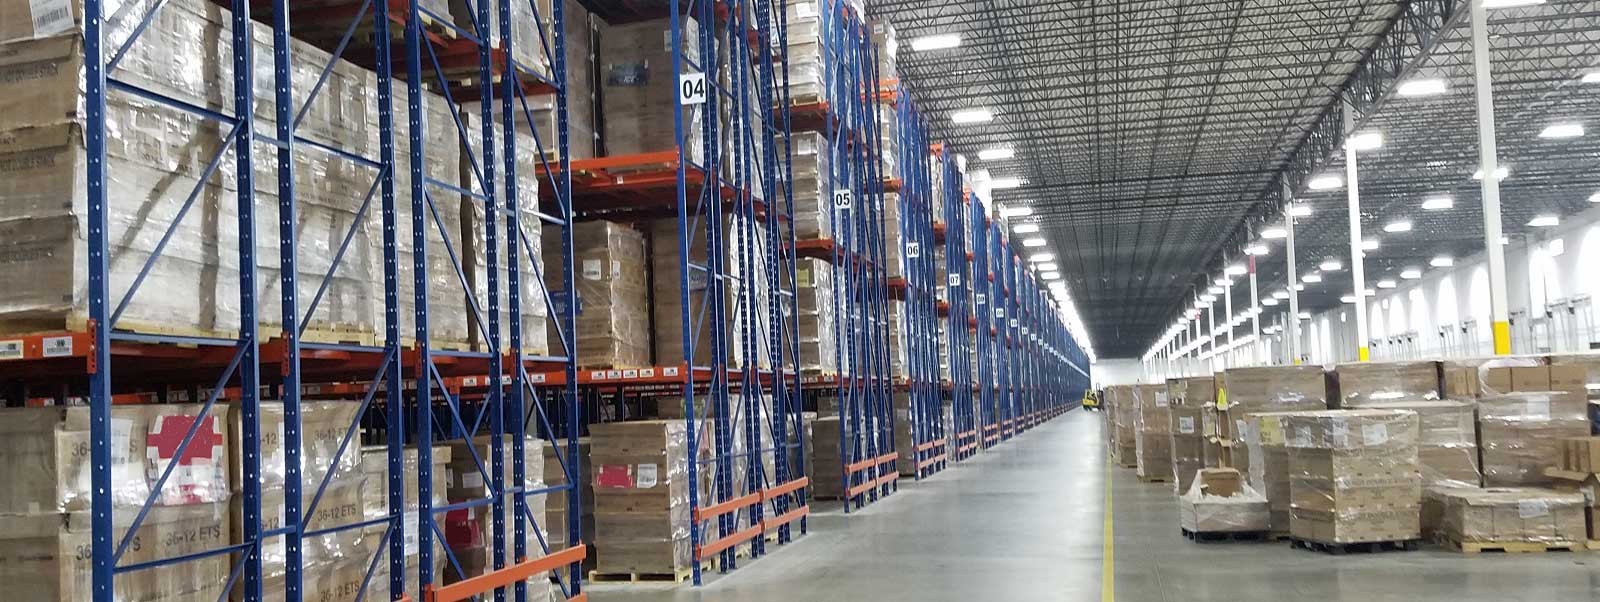
One major factor contributing to the warehouse sector's sturdy performance coming into 2020 was the continued rise of e-commerce. As consumers took more of their retail business online demanding speedier delivery times - companies looked for warehouse space that was closer to their customers, often closer to larger metropolitan areas.

Prologis noted that preliminary estimates suggested a 50-percent rise in e-commerce sales in March, versus the recent trend of around 15 percent. Especially notable, the report added, were gains in categories such as groceries.

In short – prepare to pay more for space while making a term commitment. Short term deals are hard to get in this environment as landlords are unwilling to tie up space and miss out on a long-term lease.

Logistics Managers’ Index confirms capacity challenges

Supply chain data shows transportation capacity has declined to a 22-month low with utilization and prices reaching 19-month highs.

Those were a couple of the highlights from a report summarizing July data from the Logistics Managers’ Index (LMI), a survey of leading logistics executives. The overall index increased to a reading of 63 percent during the month, up 130 basis points from June and well off the all-time April low of 51.3 percent. The July mark was the highest for the index since January 2019.

The LMI is a diffusion index, wherein a reading above 50 percent indicates expansion and a reading below 50 percent indicates contraction.

Transportation capacity tightened further during July with the sub-index declining 680 basis points to a reading firmly in contraction territory at 42.8 percent. Transportation utilization remained elevated, unchanged at 66.7 percent for the month.

Similar results have been seen in FreightWaves’ Outbound Tender Reject Index, a measure of the number of loads tendered to and rejected by carriers. Currently, the index stands near all-time highs at a 25 percent rejection rate.

Inventories remained at an elevated level for the month at 57.2 percent but 710 basis points lower than June and 1,000 basis points lower than July 2019. Inventory costs accelerated 570 basis points to a reading of 69.1 percent. Limited warehouse space was cited as the primary reason for the cost increases.

The warehousing capacity sub-index increased 830 basis points to the neutral level of 50 percent, an increase from the all-time low of 41.3 percent in June. The report said incremental warehouse space hasn’t been added, it has just stopped contracting. “There is still significant evidence that warehouse space is tight, with firms fighting to lock down prime storage space in anticipation of an ecommerce-heavy Q4.”

Warehouse capacity is lower, and prices higher, for upstream firms. This suggests that industries a step or two removed from the customer are having more difficulty locating affordable facilities to store their goods. Whether or not this is indicative of increased demand (manifested in quicker inventory turns) or decreased demand (manifested in cancelled orders to suppliers) downstream remains to be seen.

The LMI is a collaboration among Arizona State University, Colorado State University, Rochester Institute of Technology, Rutgers University and the University of Nevada, Reno, conducted in conjunction with the Council of Supply Chain Management Professionals.

Current truckload market tightens

FreightWaves reports their Outbound Tender Volume Index (OTVI) climbed another 1.4 percent this week to a new all-time high of 16,053. OTVI has posted a string of consecutive all-time highs for many weeks now. It is important to note that OTVI does include rejected contract load tenders, so the true organic growth of load volumes is significantly lower than the indexed reading. This does not mean the index is not directionally accurate or not indicative of the overall strength in the freight market. However, the rate of volume acceleration has begun to slow.

To account for the high level of rejected tenders in our Outbound Tender Volume Index, a new metric, a proxy index for accepted tenders, has been calculated. Using this correction, volumes are running up about 19 percent year-over-year and are at a three-year high. Carriers are rejecting one in four contracted load tenders, and spot rates have pushed north of $2.75 per mile on a national basis.

Fortunately, Hurricane Laura did not create the major regional disruption event that many thought was possible. Also, Laura missed major population centers in Houston and New Orleans. However, the waters and atmosphere of the Atlantic and Gulf of Mexico are primed for storms at the height of hurricane season.

DAT Solutions reports that in the week ending September 6th, the average linehaul rate for dry van freight set an all-time record high in August (all-in spot rates were higher in June 2018 due to higher fuel surcharges). That momentum continued last week, with shippers and freight brokers paying higher prices to move freight ahead of the Labor Day weekend.

Produce harvests are also following normal seasonal patterns, but the recent upticks in COVID-19 cases add uncertainty, with new hotspots emerging in Texas and Arizona. Reefer volumes held steady compared to the previous week, with the number of lanes with higher rates versus lower rates basically even.

Look at this national average dry van spot rate trend:

  • June                             $1.81 per mile
  • July                              $2.04 per mile
  • August                         $2.22 per mile
  • September                  $2.40 per mile

Rail intermodal rises

Although U.S. rail traffic declined 5.8 percent in August compared with the same month a year ago, total intermodal volume rose 3 percent to 1,122,954 containers and trailers, according to Association of American Railroads (AAR) data.

U.S. railroads logged 898,227 carloads last month, down 14.9 percent from August 2019, while total combined volume fell to 2,021,181 carloads and intermodal units. Still, the monthly U.S. intermodal volume gain was a highlight in AAR's August traffic report.

For U.S. railroads, August 2020 was the best month in terms of intermodal loadings since October 2018, and the fifth best intermodal month ever.

With truckload capacity declining and prices rising, expect long-haul freight to be diverted to intermodal.

At Wagner Logistics

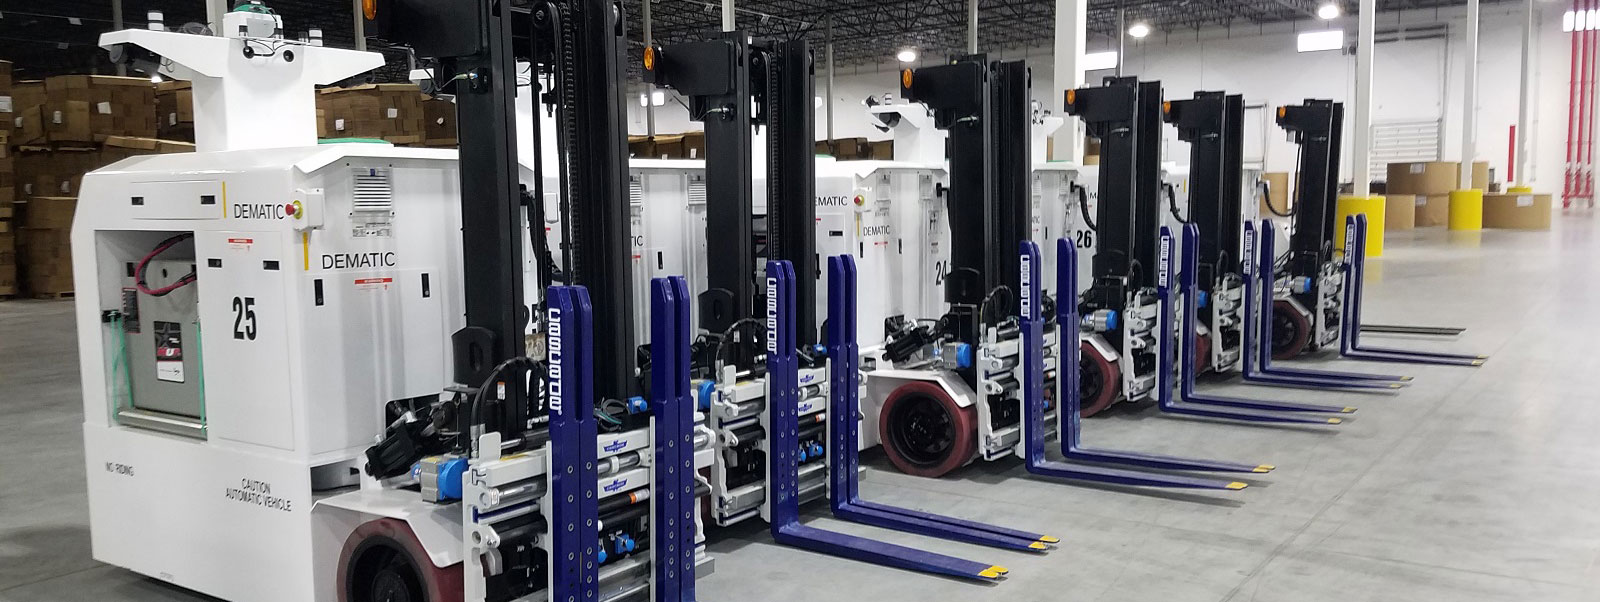
As Wagner on-boards its newest contract customer, Olin Winchester, all hands are on deck to smoothly transition the business in October. New material handling equipment, trucks, and hardware are ordered while the IT and Solutions teams integrate systems.

The Wagner HR team is deep into hiring the 50+ associates to staff the operation as training begins.

What may Wagner Logistics do for you? We have an extensive history of 74 years of service to our customers and would love the opportunity to collaborate with you.

As we say every day, Bring it!

Have a great day!

John Wagner Jr. 

About Wagner Logistics

Wagner Logistics was founded in 1946 on the principle that every customer is a big deal and that continues to pervade our mentality, producing a superior customer experience. The company began in trucking and remains dynamic offering top-notch transportation, dedicated warehousing and robust fulfillment services. We strive to produce innovative solutions, in addition to our superior onboarding process which makes transitions seamless, and have been honored 20 years in a row by Inbound Logistics as a Top 100 3PL. Our customers drive our entry into new geographic markets, technological advances and ever-changing distribution challenges. Where do you want to be? Wagner says, Bring It!