
Unemployment rises
Applications for unemployment claims, a proxy for layoffs, rose by 181,000 to 965,000 last week, the Labor Department said Thursday, reflecting rising layoffs amid a winter surge in coronavirus cases.
The total for the week ended Jan. 9 also was the highest in nearly five months and put claims well above the roughly 800,000 a week they had averaged in recent months.
The labor-market recovery stalled last month with the December jobs report showing the U.S. lost 140,000 payroll positions. The economic recovery’s slowdown has included weakness in household spending, though economists expect the economy to rebound later this year as a Covid-19 vaccine is distributed through the population
Last month’s job loss came almost entirely from one sector: hospitality and leisure lost 498,000 jobs. Other industries added jobs last month, including retailers, factories and construction firms. Retailers added 121,000 jobs in December, which may have reflected consumers stepping up spending for the holidays.
Logistics-sector hiring is helping shore up the jobs market with parcel-delivery, warehousing and trucking companies adding a combined 52,900 jobs last month.
Manufacturing recovering
Manufacturing activity finished 2020 on a high note, growing for the seventh consecutive month, according to data issued today by the Institute for Supply Management (ISM).
In its monthly Manufacturing Report on Business, ISM said that the report’s key metric, the PMI, came in at 60.7 (a reading of 50 or higher indicates growth), which was 3.2 percent above November’s 57.5, while the overall economy expanded for the eighth consecutive month. This represents the highest PMI reading for 2020, with October’s 59.3 and November’s 57.5 rounding out the top three months. And December’s PMI is 8.2 percent higher than the 12-month average of 52.5.
ISM reported that 16 of the 18 manufacturing sectors it tracks saw growth in December, including: Apparel, Leather & Allied Products; Furniture & Related Products; Wood Products; Fabricated Metal Products; Machinery; Computer & Electronic Products; Transportation Equipment; Plastics & Rubber Products; Paper Products; Chemical Products; Petroleum & Coal Products; Primary Metals; Textile Mills; Electrical Equipment, Appliances & Components; Food, Beverage & Tobacco Products; and Miscellaneous Manufacturing. And the two industries that contracted were Printing & Related Support Activities and Nonmetallic Mineral Products.
New orders, which are commonly referred to as the engine that drives manufacturing, rose 2.8 percent, to 67.9, growing, at a faster rate, for the seventh consecutive month. This matched October’s reading for the highest, for any month, going back to January 2004’s 70.6. And the report said that 13 of the 18 manufacturing sectors it tracks saw new orders gains in December, including the six largest manufacturing sectors.
Ports struggling with volume
Retail imports, which were a key contributor to the surge in container traffic and port activity in the second half of 2020, are projected to continue their strength through the first half of 2021 according to new data from the National Retail Federation and Hackett Associates. The retail trade organization projects, despite the pandemic, that retail imports set a new record for 2020 and will continue the momentum for at least the first five months of 2021.
According to the organizations’ monthly Global Port Tracker report, imports during the second half of 2020 set a string of new records, including an all-time high of 8.3 million TEU for the July-October “peak season” when retailers rush to bring in merchandise for the winter holidays. Pending final numbers for December, they are projecting 2020 will have ended with a total of 21.9 million TEU, up 1.5 percent from 2019, and breaking the previous annual record of 21.8 million TEU set in 2018.
Trucking market elevated, still
What’s happening? On average, surveys show shippers expect their truckload contract rates to increase by 6.9 percent year over year in 2021 (vs. the expectation last year for a 1.0 percent decline in 2020). Shippers are highly concerned about the availability of capacity in 2021 and 58 percent expect to support further contractual rate increases in 2022. LTL rates are expected to increase 4.4 percent in 2021, the highest expected increase since 2018.
From a demand perspective, 74 percent of shippers expect accelerating demand for their own products in 2021 and 74 percent are entering 2021 with a product inventory level that is either "Low" (58 percent) or "Very Low" (16 percent).
Continued low inventories at the retail and wholesale level will keep carriers busy for months to come. Truckload carriers remain constrained with a shortage of drivers with very few entering the industry so expect the market to remain elevated.
With Class 8 truck sales and orders for trailers recovering, I hope this indicates future capacity.
DAT Solutions reports that in the week ending January 10th, the spot market returned to regular business following the holidays, with large increases in load and truck posts on the DAT One load board network. Capacity returned at a quicker pace, lowering load-to-truck ratios. As a result, rates fell on most lanes, while national averages remain above the December averages.
One should remember that the spot market accounts for 30 percent of all freight moving on trucks.
Railroads see gains
U.S. freight railroads posted a 4.7 percent increase in traffic hauled during the first week in January compared with traffic recorded for the comparable period in 2020, according to Association of American Railroads (AAR) data.
Railroads hauled 235,4040 carloads, down 1.6 percent, and 289,849 containers and trailers, up 10.4 percent, for the week ending Jan. 9.
Four of the 10 carload commodity groups that AAR follows every week posted an increase. They included grain, up 9,386 carloads to 27,650; metallic ores and metals, up 2,524 to 23,600; and chemicals, up 2,458 to 36,195.
December ended with Class I intermodal volume accelerating with a scorching 20.8 percent year over year growth (four-week moving average 10.7 percent). Average intermodal train velocities declined by 0.5 mph (1.5 percent) week-over-week. Intermodal tender rejections on a national basis rose to 4.68 percent.
At Wagner Logistics
Wagner is starting the year with a positive mindset and growth. The team is working on the implementation of a new distribution center in southern California, our third location in that state.
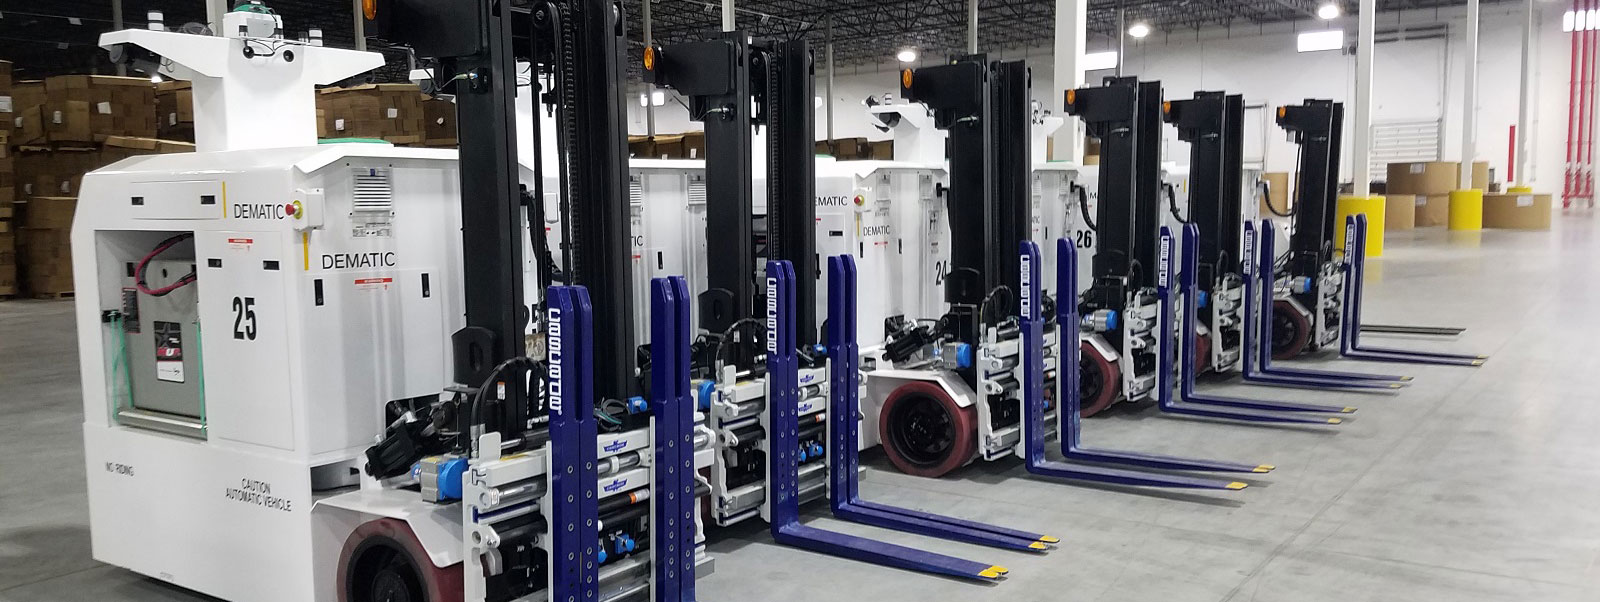
We also await the delivery of our robotics solution for driving labor efficiency and accuracy in Wagner’s fulfillment services. Kudos to the Solutions team who have worked tirelessly to design and execute these new processes.
I must mention that I write this edition of my blog with a heavy heart. We lost a 22-year tenured associate, Ginger Clare, who was a huge part of our HR group and a positive personality in the office. She will be dearly missed.
As always, I end asking you that if there is a transportation RFP or distribution project on your horizon for 2021 please let me know. We have an extensive history of 74 years, oops, make that 75 years now of service to our customers. We would love the opportunity to collaborate with you.
As we say every day, Bring it!
Have a great day!
John Wagner Jr.
About Wagner Logistics
Wagner Logistics was founded in 1946 on the principle that every customer is a big deal and that continues to pervade our mentality, producing a superior customer experience. The company began in trucking and remains dynamic offering top-notch transportation, dedicated warehousing and robust fulfillment services. We strive to produce innovative solutions, in addition to our superior onboarding process which makes transitions seamless, and have been honored 20 years in a row by Inbound Logistics as a Top 100 3PL. Our customers drive our entry into new geographic markets, technological advances and ever-changing distribution challenges. Where do you want to be? Wagner says, Bring It!